Richest Cities in South Carolina (2026)
by Kristen Carney
Updated: February 9, 2026
Richest City in South Carolina
The richest city in South Carolina is Kiawah Island in Charleston County with an average household income of $404,011 as of 2024. While exceptionally affluent, Kiawah Island only has a population of 2,326 as of 2024. The richest city in South Carolina with at least 5,000 people is Tega Cay in York County with an average household income of $183,862 as of 2024 and 13,615 people as of 2024 according to the most current Census data available (citation).
| Rank | City | County | Population | Average Income | Median Income |
|---|---|---|---|---|---|
| 1 | Kiawah Island | Charleston | 2,326 | $404,011 | $213,594 |
| 2 | Sullivan's Island | Charleston | 2,087 | $298,004 | $192,813 |
| 3 | Isle of Palms | Charleston | 4,362 | $269,949 | $156,979 |
| 4 | DeBordieu Colony | Georgetown | 627 | $262,040 | $170,750 |
| 5 | Briarcliffe Acres | Horry | 448 | $261,336 | $156,250 |
| 6 | Seabrook Island | Charleston | 2,204 | $229,809 | $127,500 |
| 7 | Pimlico | Berkeley | 1,765 | $203,369 | $137,070 |
| 8 | Pawleys Island | Georgetown | 170 | $189,109 | $122,500 |
| 9 | Tega Cay | York | 13,615 | $183,862 | $142,000 |
| 10 | Smyrna | Cherokee; York | 38 | $183,747 | $63,750 |
| 11 | Mount Pleasant | Charleston | 93,993 | $172,978 | $124,755 |
| 12 | Daufuskie Island | Beaufort | 619 | $172,115 | $156,090 |
| 13 | Baxter Village | York | 4,542 | $168,952 | $151,629 |
| 14 | Folly Beach | Charleston | 1,267 | $167,200 | $102,279 |
| 15 | Five Forks | Greenville | 18,656 | $166,188 | $141,786 |
| 16 | Bluffton | Beaufort | 33,157 | $160,804 | $111,281 |
| 17 | McClellanville | Charleston | 690 | $153,311 | $107,083 |
| 18 | The Cliffs Valley | Greenville | 789 | $151,334 | $108,964 |
| 19 | Hilton Head Island | Beaufort | 37,911 | $151,065 | $94,657 |
| 20 | Fort Mill | York | 30,775 | $150,825 | $121,823 |
Median Income versus Average Income: Which Should You Use?
We usually suggest using median income data – either instead of or in addition to – average income data as a true indicator of wealth. If you haven’t thought about median versus average since your last standardized test, you aren’t alone. Here’s what they are:
- average is the sum of a set of numbers divided by the count of numbers in the set
- median is the middle number in the set of numbers
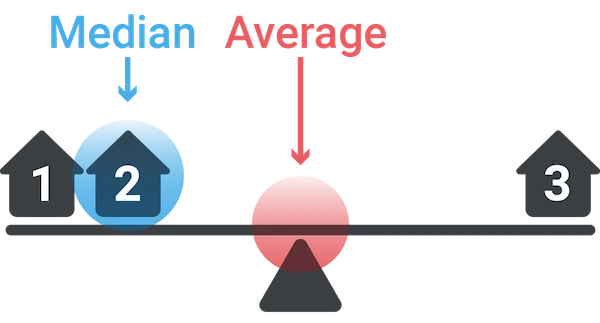
Now let’s say you had the following simplified set of income data.
Household 1: $30,000
Household 2: $50,000
Household 3: $1,000,000
The average income for this set is $360,000. The outlier data point ($1,000,000) skews the average WAY up. Conversely, the average income would be skewed WAY down if someone had an income of $500. The median income for the same data set is $50,000. Outlier data doesn’t skew the median.
Most Business Owners Should Use Median Income
So most business owners should use the median income as a true indicator of wealth, because it provides a more accurate representation of a typical income, especially in areas with significant income disparity.
When Should You Use Average Income
If your target market is high-income households, the average income may be more relevant. This is because the average income can highlight the presence of a higher concentration of wealthy individuals, which is beneficial for luxury goods and services marketing. We’re using average income on this page because using the Census’s highest reported median value of $250,001 could result in multiple ties for the richest geography.
Why do so many cities have a median value of $250,001?
The Census' American Community Survey uses $250,000+ as a jam value for median income estimates to protect privacy, ensure data consistency, and simplify reporting. A "jam value" in survey data refers to a placeholder or default value used when actual data points are unavailable, incomplete, or exceed certain thresholds. We represent this jam value as $250,001 to make it easy for you to sort.
You might also be interested in:
Email Me When New Data Are Released
Join thousands of subscribers and receive just 1 (ONE!) email a year in December when the US Census Bureau releases new income data for South Carolina richest cities.
SOURCES
United States Census Bureau. Annual Estimates of the Resident Population: April 1, 2020 to July 1, 2023. U.S. Census Bureau, Population Division. Web. May 2024. http://www.census.gov/.
United States Census Bureau. B01001 SEX BY AGE, 2024 American Community Survey 5-Year Estimates. U.S. Census Bureau, American Community Survey Office. Web. 29 January 2026. http://www.census.gov/.
United States Census Bureau. B19013 Median Household Income, 2024 American Community Survey 5-Year Estimates. U.S. Census Bureau, American Community Survey Office. Web. 29 January 2026. http://www.census.gov/.
United States Census Bureau. "DP03 SELECTED ECONOMIC CHARACTERISTICS." 2024 American Community Survey 5-Year Estimates. U.S. Census Bureau, American Community Survey Office. Web. 29 January 2026. http://www.census.gov/.
Products & Services
Plumbing
Connect
- 1-800-939-2130
- Contact Us
© Copyright 2026 Cubit Planning, Inc.